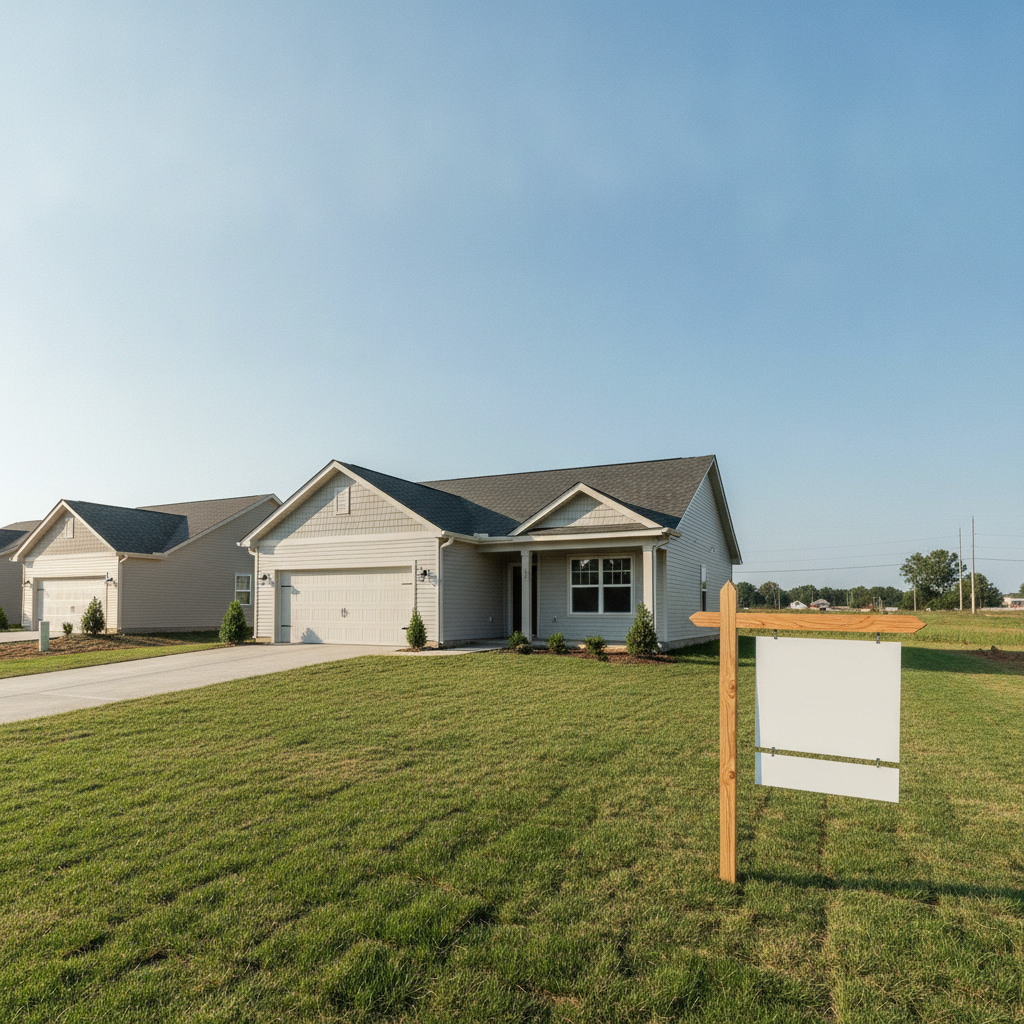
The national housing market is experiencing shrinkflation, a trend where new single-family homes are decreasing in size while their price per square foot increases. This development, highlighted in an analysis of U.S. Census Bureau data released on August 28, 2026, shows a significant shift in what homebuyers are getting for their money.
Over the past decade, the average size of new single-family homes sold nationwide declined by 11.6%, from 2,724 square feet in 2015 to 2,409 square feet in 2025. Despite this reduction in size, the average price per square foot surged by 71.9% during the same period. This trend reflects economic pressures, with builders constructing smaller homes to offset rising land, labor, and material costs. This strategy aims to keep prices within reach for buyers facing higher mortgage rates and affordability challenges.
Americans are increasingly purchasing these smaller homes. In 2025, one in four new single-family homes sold measured less than 1,800 square feet, a notable increase from 16% in 2015. Concurrently, the share of larger homes, those measuring at least 3,000 square feet, decreased from 33% to 20%. Budget constraints are a primary motivator for this shift, as mortgage rates have lingered between 6% and 7%, more than double the rates observed during the pandemic. A lower total price for a smaller home can reduce the down payment and monthly mortgage payment, which is particularly beneficial for first-time buyers.
Demographic shifts, including smaller households, also contribute to the trend. More buyers are prioritizing efficient layouts and embracing a concept of right-sizing over maximizing square footage. While the price per square foot is higher, smaller homes generally incur lower maintenance costs, offering potential long-term savings on heating, cooling, furnishing, and repairs. These recurring savings can be substantial, especially for first-time buyers whose budgets may already be stretched by mortgage payments, property taxes, and insurance.
Regionally, the South experienced the sharpest decline in average new-home size over the past decade, with a 13.4% decrease. The Midwest followed with a 12.2% decline, and the West saw a 9.2% reduction. In 2025, the Midwest had the highest proportion of smaller homes sold, with 31% under 1,800 square feet, followed by the West at 28% and the South at 24%. The Northeast was an outlier, being the only region where the average new-home size increased, growing by 1.1% to an average of 2,866 square feet last year. This is attributed to high land and construction costs, which often lead builders in the Northeast to focus on larger, higher-end homes. However, this extra space comes at a cost, as the Northeast also saw the largest jump in average price per square foot, rising 97.2% since 2015.